This is my first attempt at developing a machine learning model for quantitative analysis and trading. I don't know what to expect, but I do know I will encounter a lot of challenges along the way. This model will be very simple and likely under/overfit, inaccurate, and not useful for trading.
Objective: Create a simple XGBoost model to predict weekly resistance levels for SPY.
Data
- SPY daily price data (20 years)
Preprocessing the data
- Columns:
datetime,high,low - Round the
highandlowto ticks (1% of the price to 1 significant digit) - Add a column for the
dayof the week (0-4)
Preparing the dataset
- Features: array of
highandlowprices - 10 days of data (2 weeks from Monday to Friday)
- Exclude data if it doesn't have 10 days of data
- Target: next week's
highandlowprice for the week
Model
Simple XGBRegressor model with 100 estimators, 0.1 learning rate and default parameters.
Data is also scaled using StandardScaler.
I know this is very bad, but I want to start simple and then improve it.
A model is trained for the high and low prices separately.
Results
XGBoost Regressor Performance for High Data:
Train MSE: 0.3408
Test MSE: 26.6598
Train R2: 1.0000
Test R2: 0.9980
XGBoost Regressor Performance for Low Data:
Train MSE: 0.2902
Test MSE: 56.1965
Train R2: 1.0000
Test R2: 0.9958Analysis
The model looks great, right? No.
for training is perfect () and test is very high ( and ) is very high too.
But, I know this is very bad. The model is likely overfitting and not generalizing well to be useful for trading.
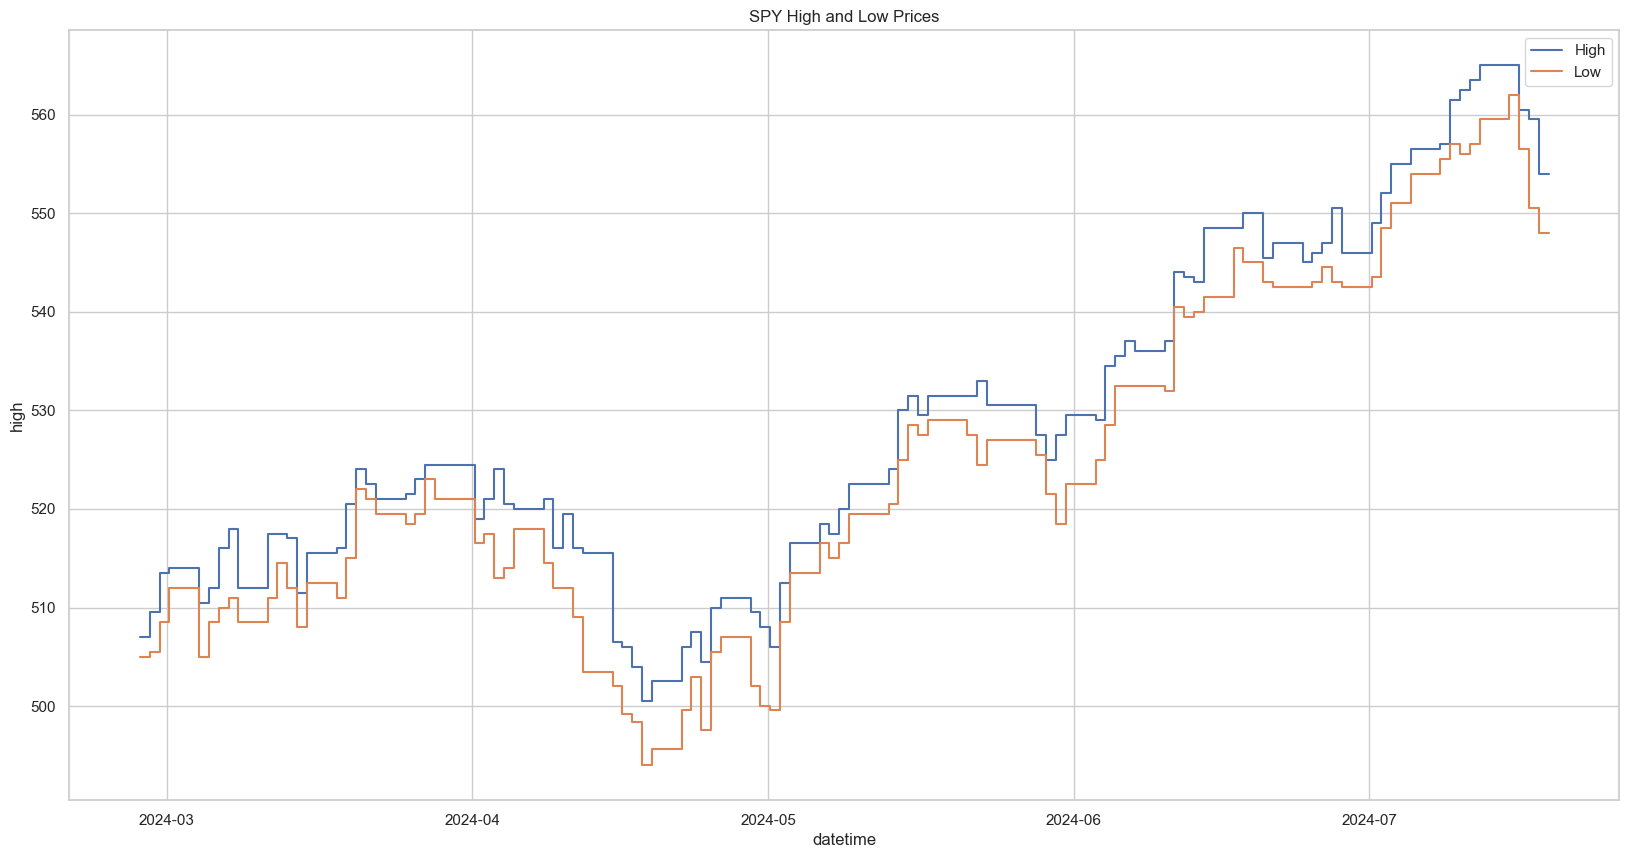
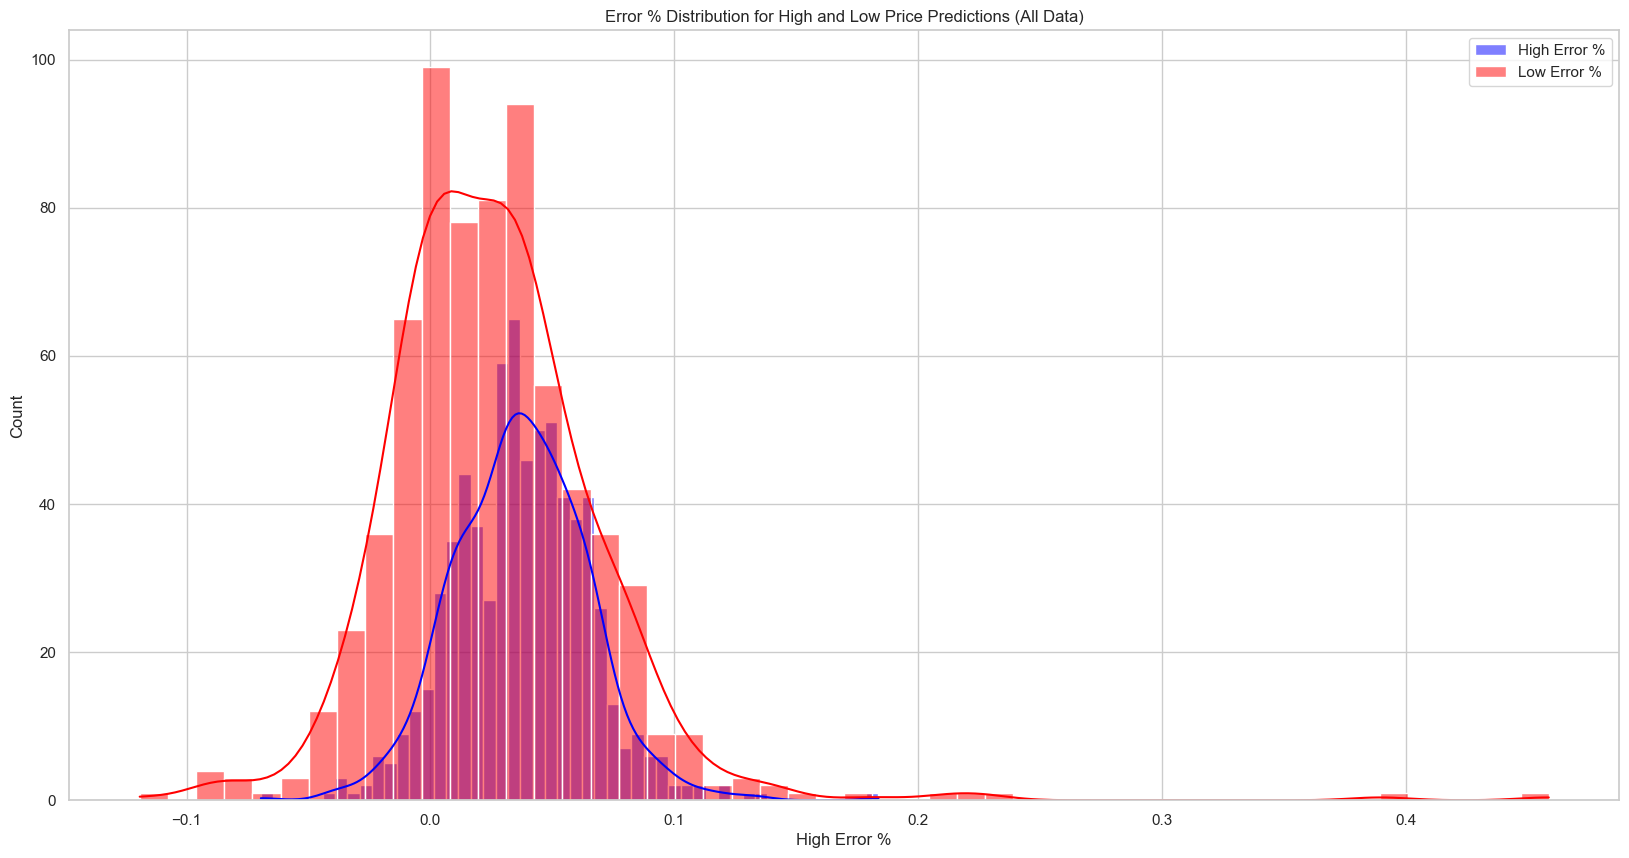
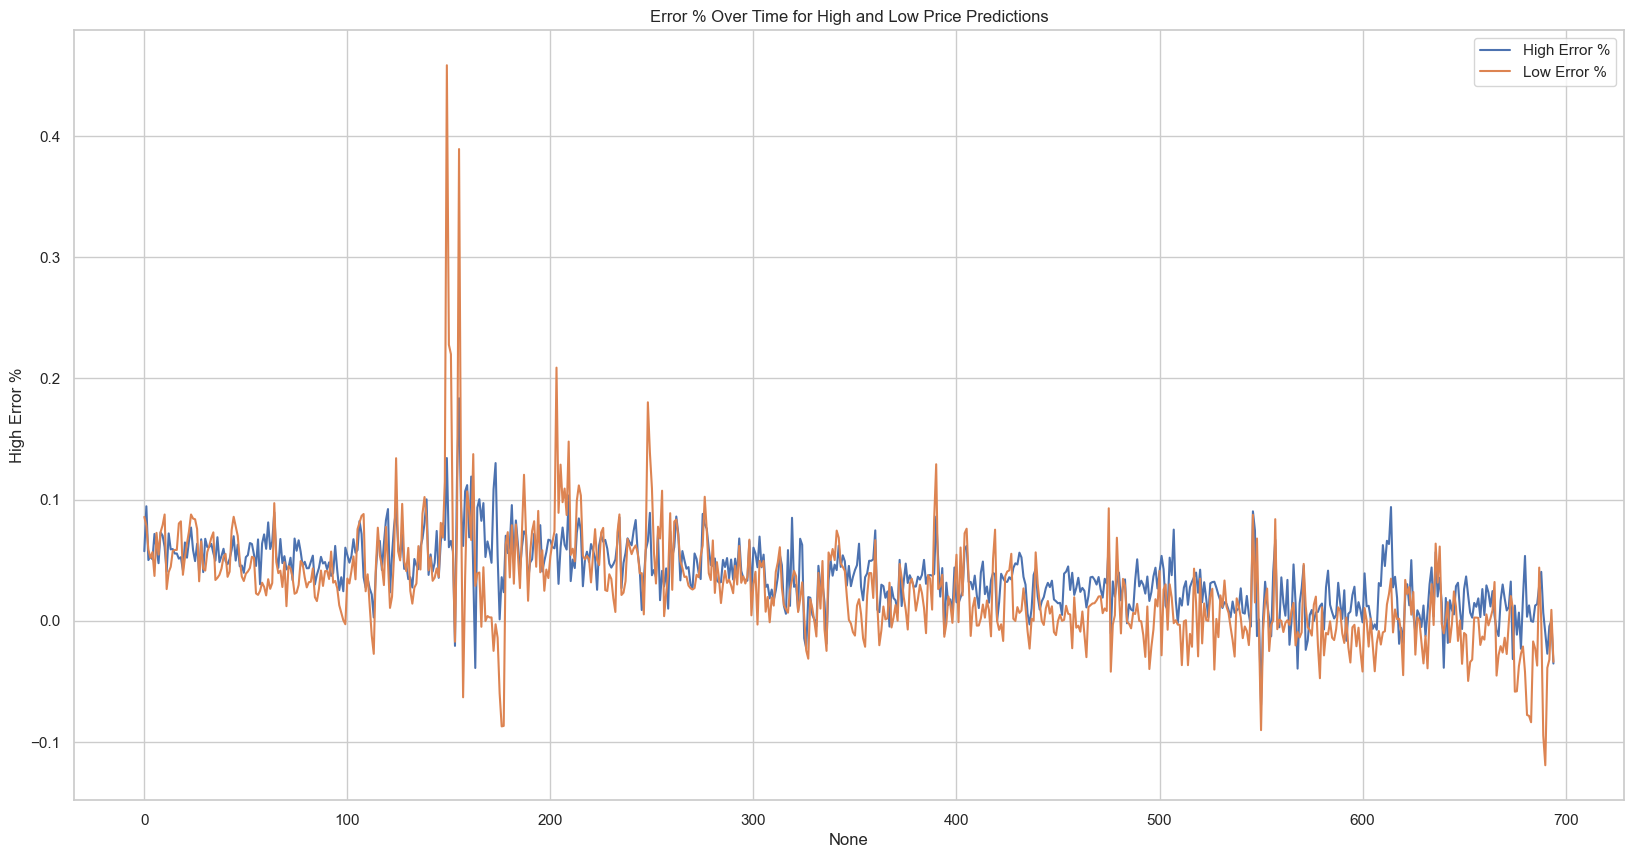
Visualizing Error
NEXT: Training a simple weekly resistance model for SPY (Part 2)